Lecture 17: Working with AI
MSE 125 — Applied Statistics
Wednesday, May 27, 2026
random forest vs. gradient boosting
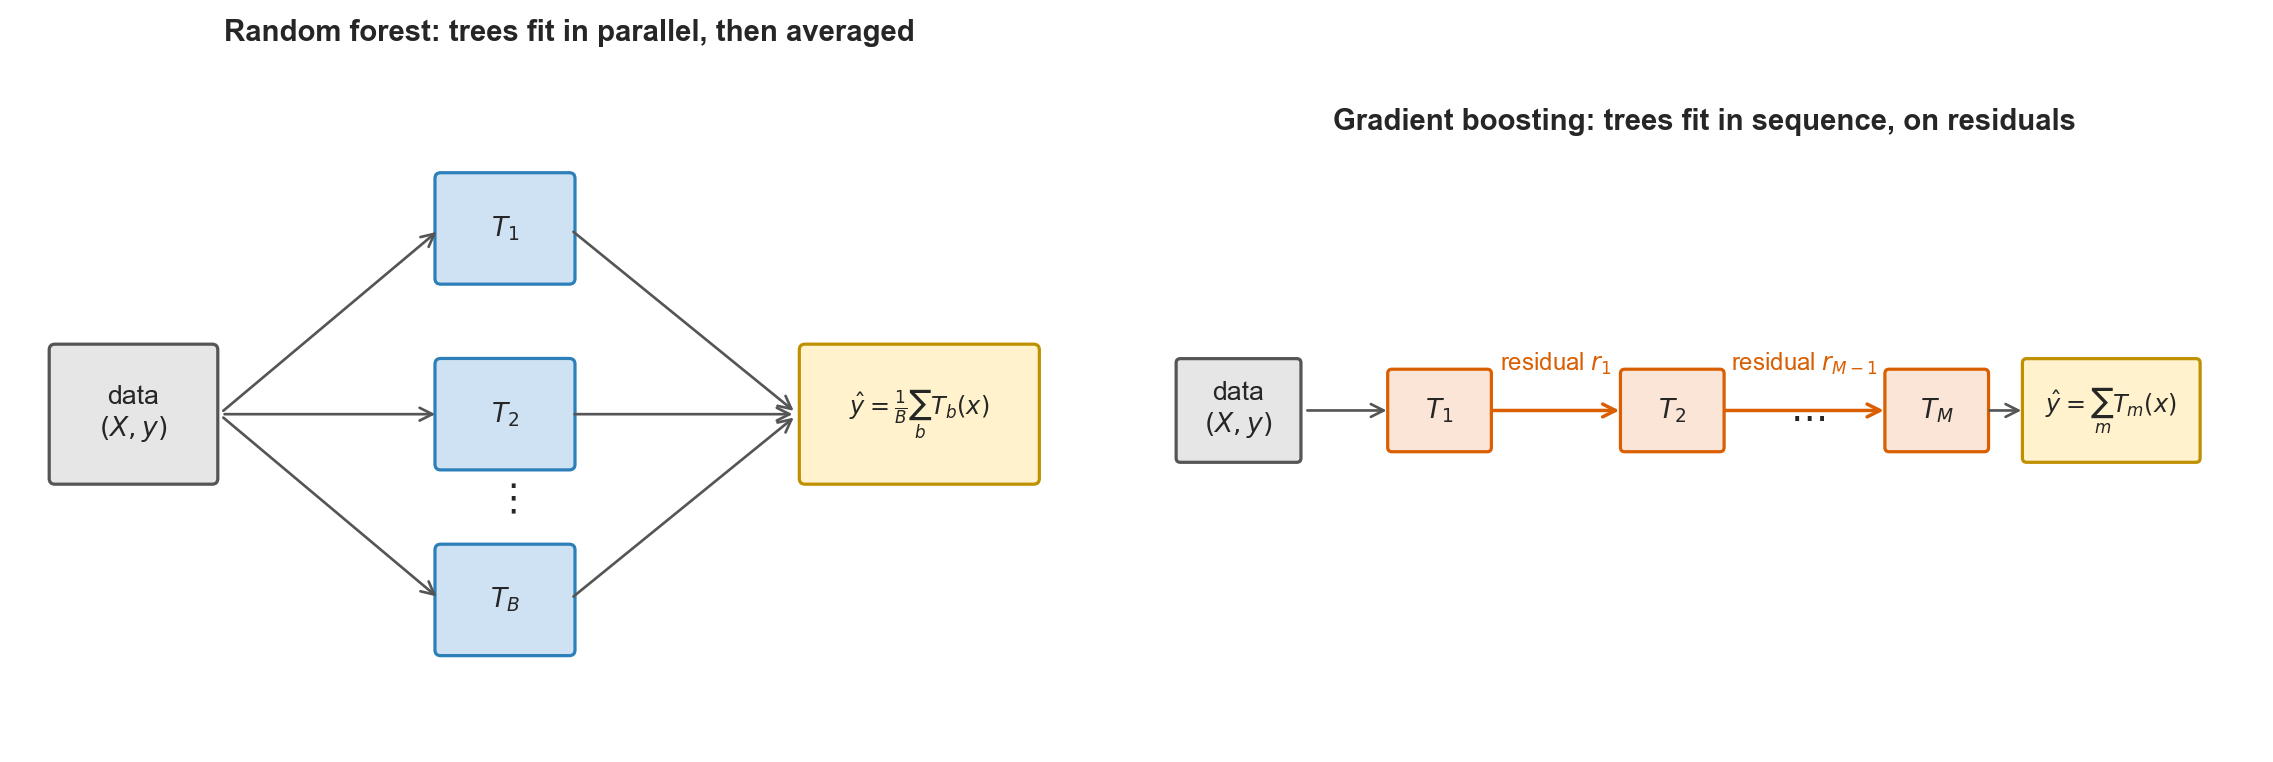
- forest averages independently grown trees
- boosting grows the next tree to fix what the ensemble missed
AutoML
AutoML (automated machine learning)
software that, given a dataset and a target, searches model families and hyperparameters and returns a fitted pipeline. examples: AutoGluon, FLAML, auto-sklearn, H2O AutoML, lightautoml, MLJAR; Vertex AI, SageMaker Autopilot, Azure AutoML
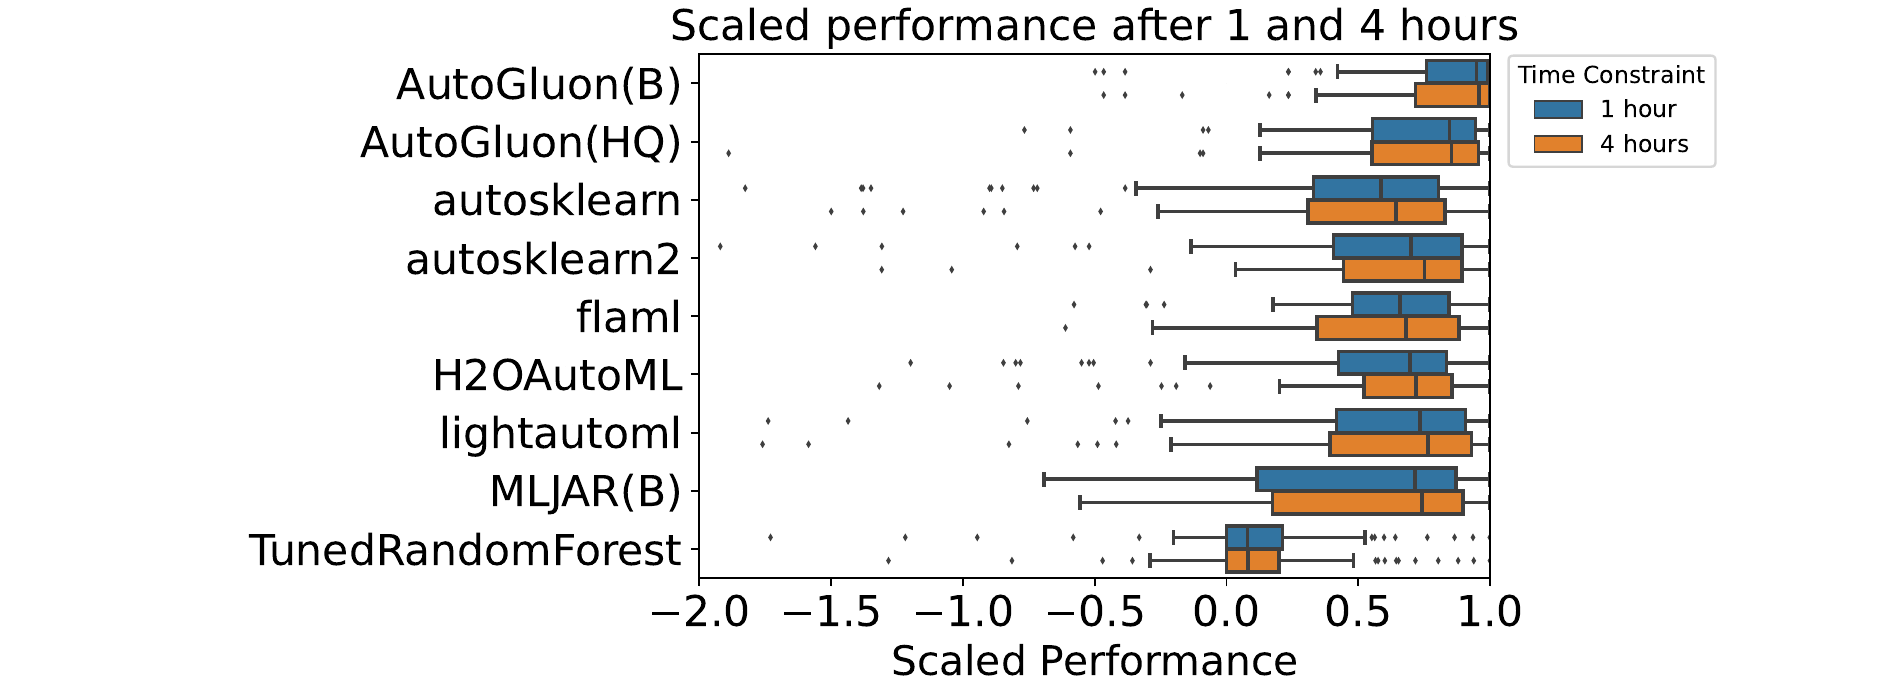
Gijsbers et al., AMLB: an AutoML Benchmark, JMLR 2024 (Fig. 4); scaled to tuned RF = 0, best observed = 1
a close call between the top two
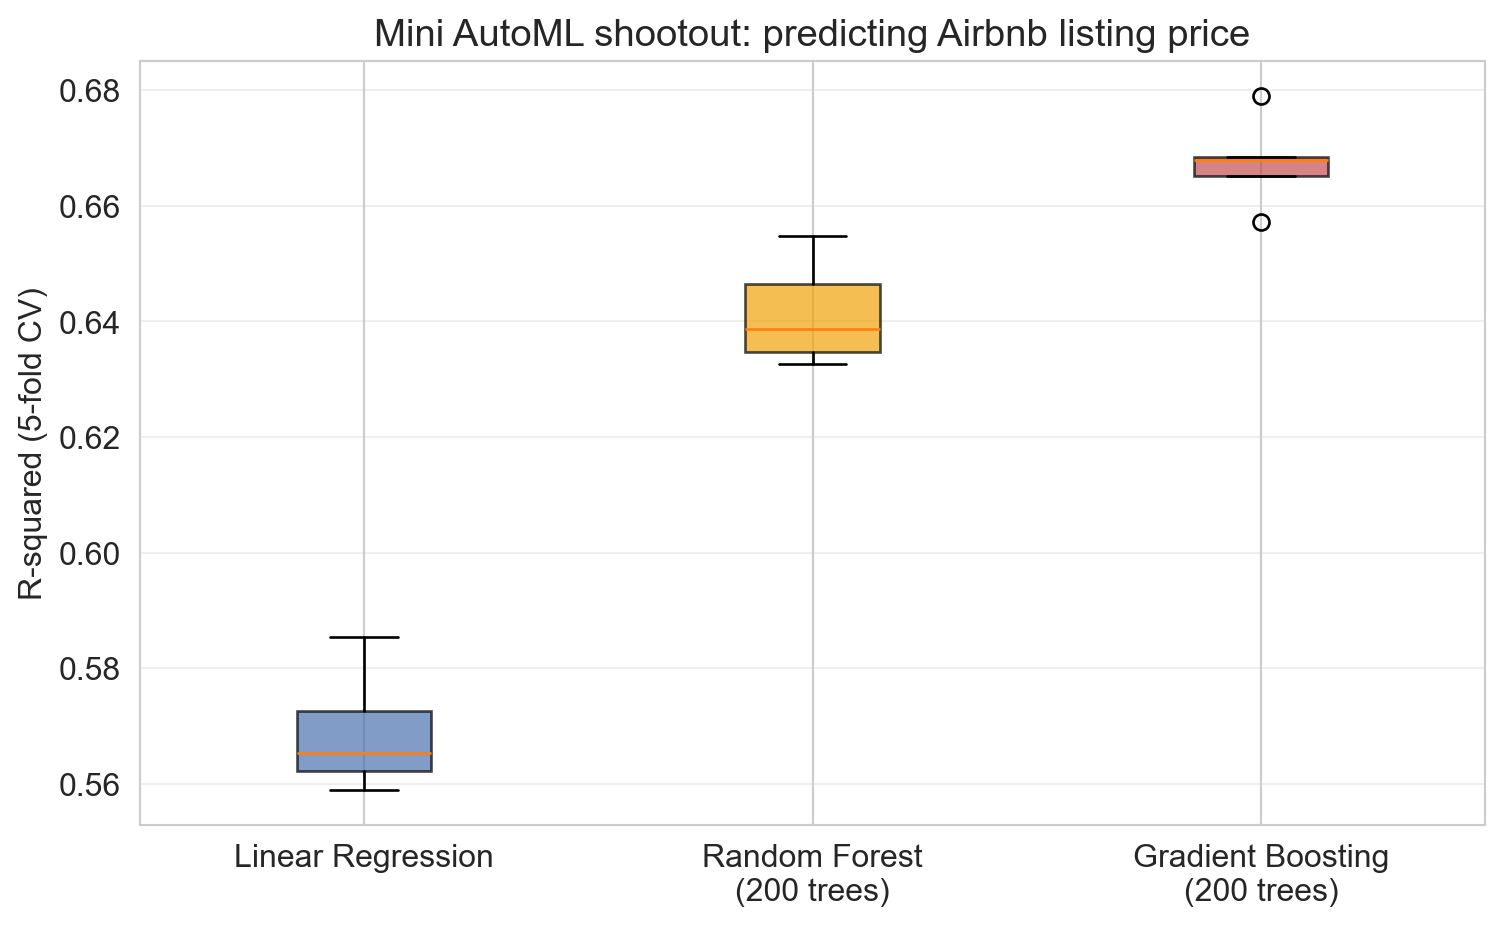
- linear regression clearly worst: Airbnb price is not linear in these features
- RF vs GB margin (~0.03) is small relative to the linear-vs-trees gap (~0.10), comparable to one outlier
AutoGluon wins by ensembling, not by smarter search
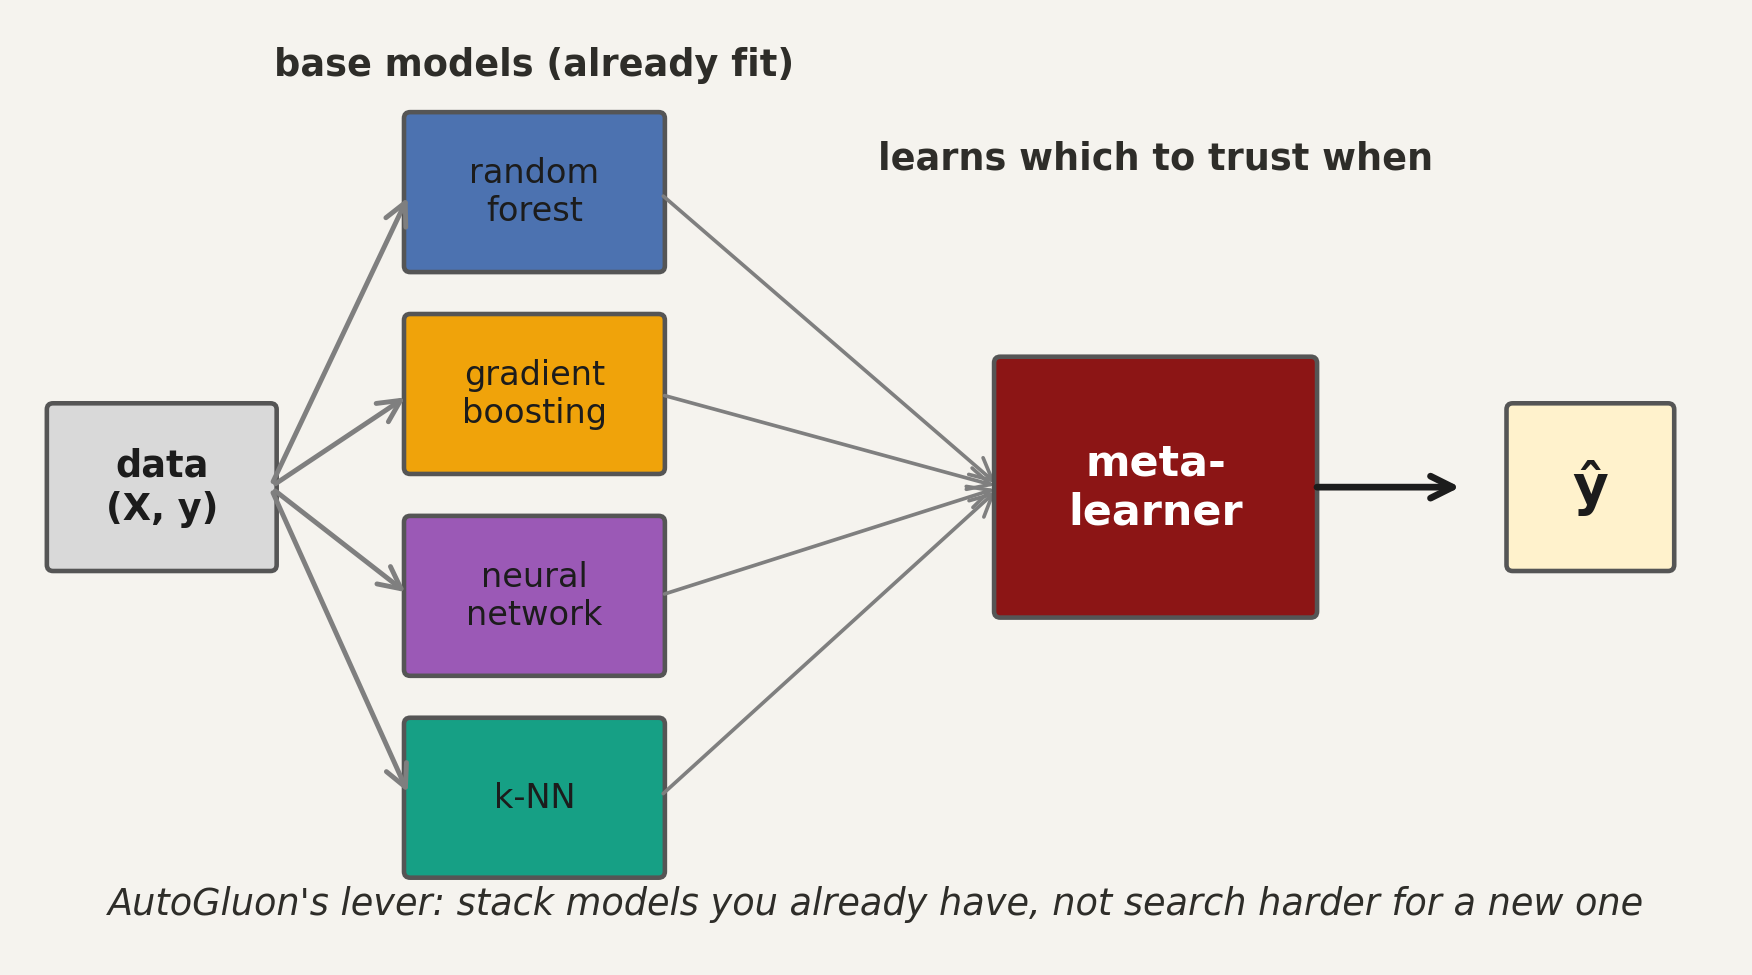
confirms a 2004 ensemble result that predates the AutoML era
Gijsbers et al., JMLR 2024 · Caruana et al., ICML 2004
foundation models
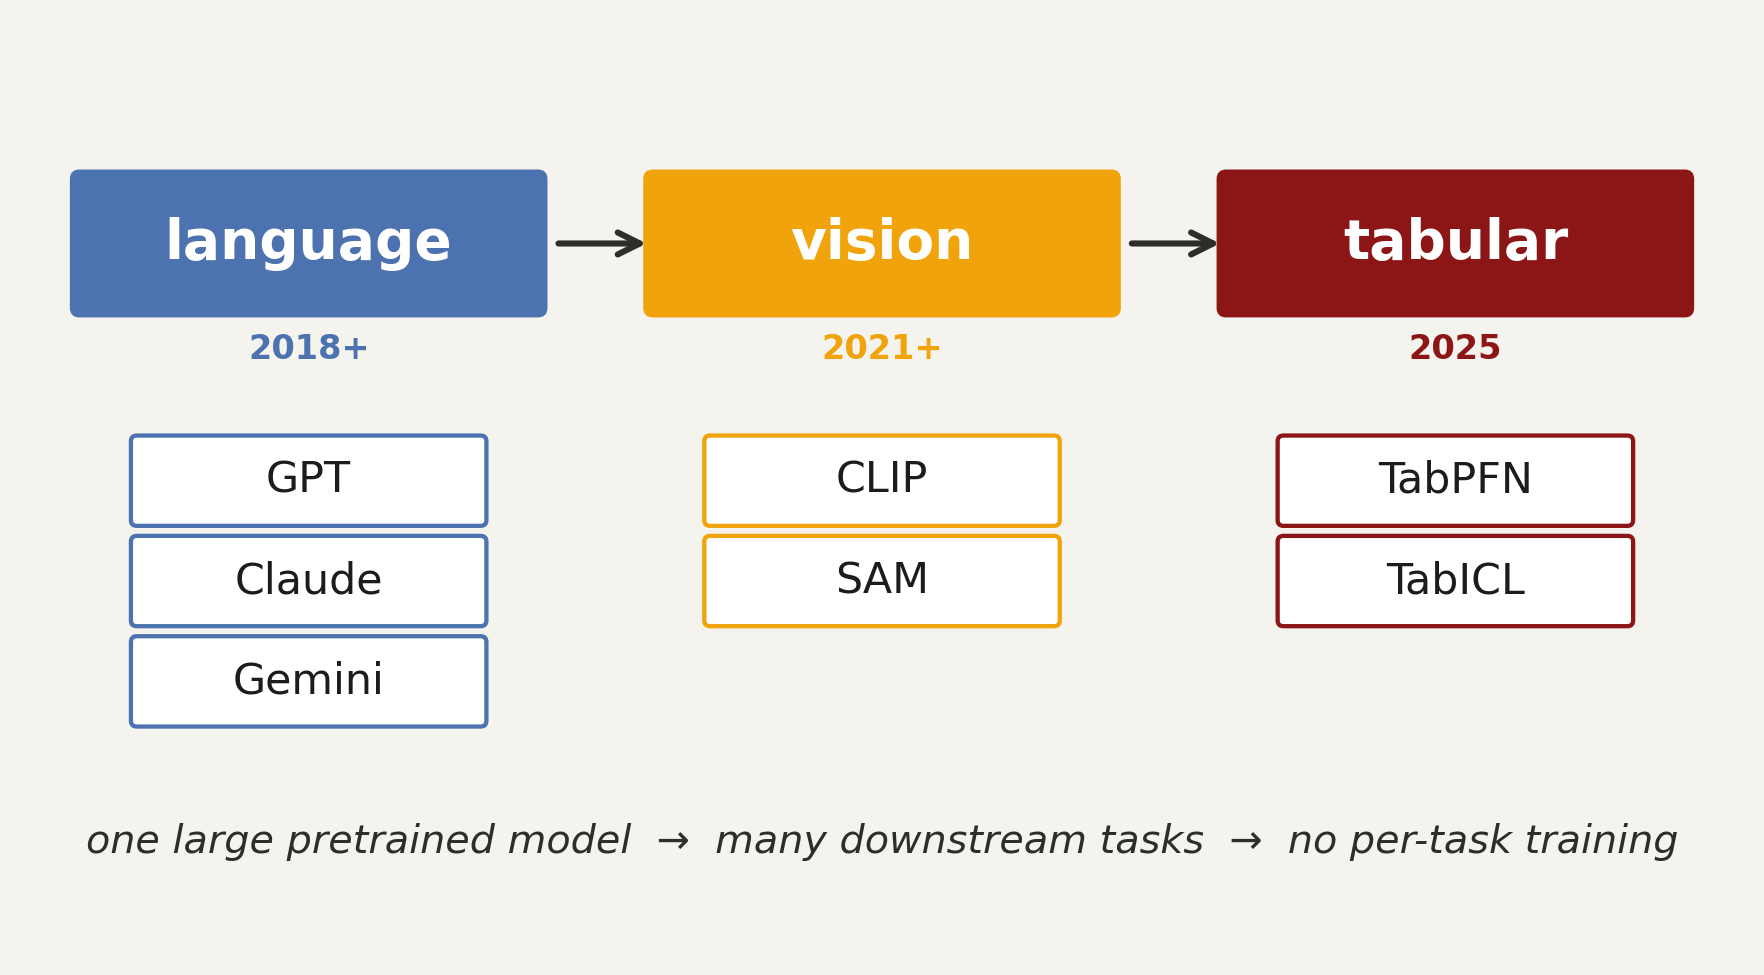
TabPFN
TabPFN (Tabular Prior-data Fitted Network)
a transformer pretrained once, offline on millions of synthetic tabular datasets. at deployment, no training, no tuning
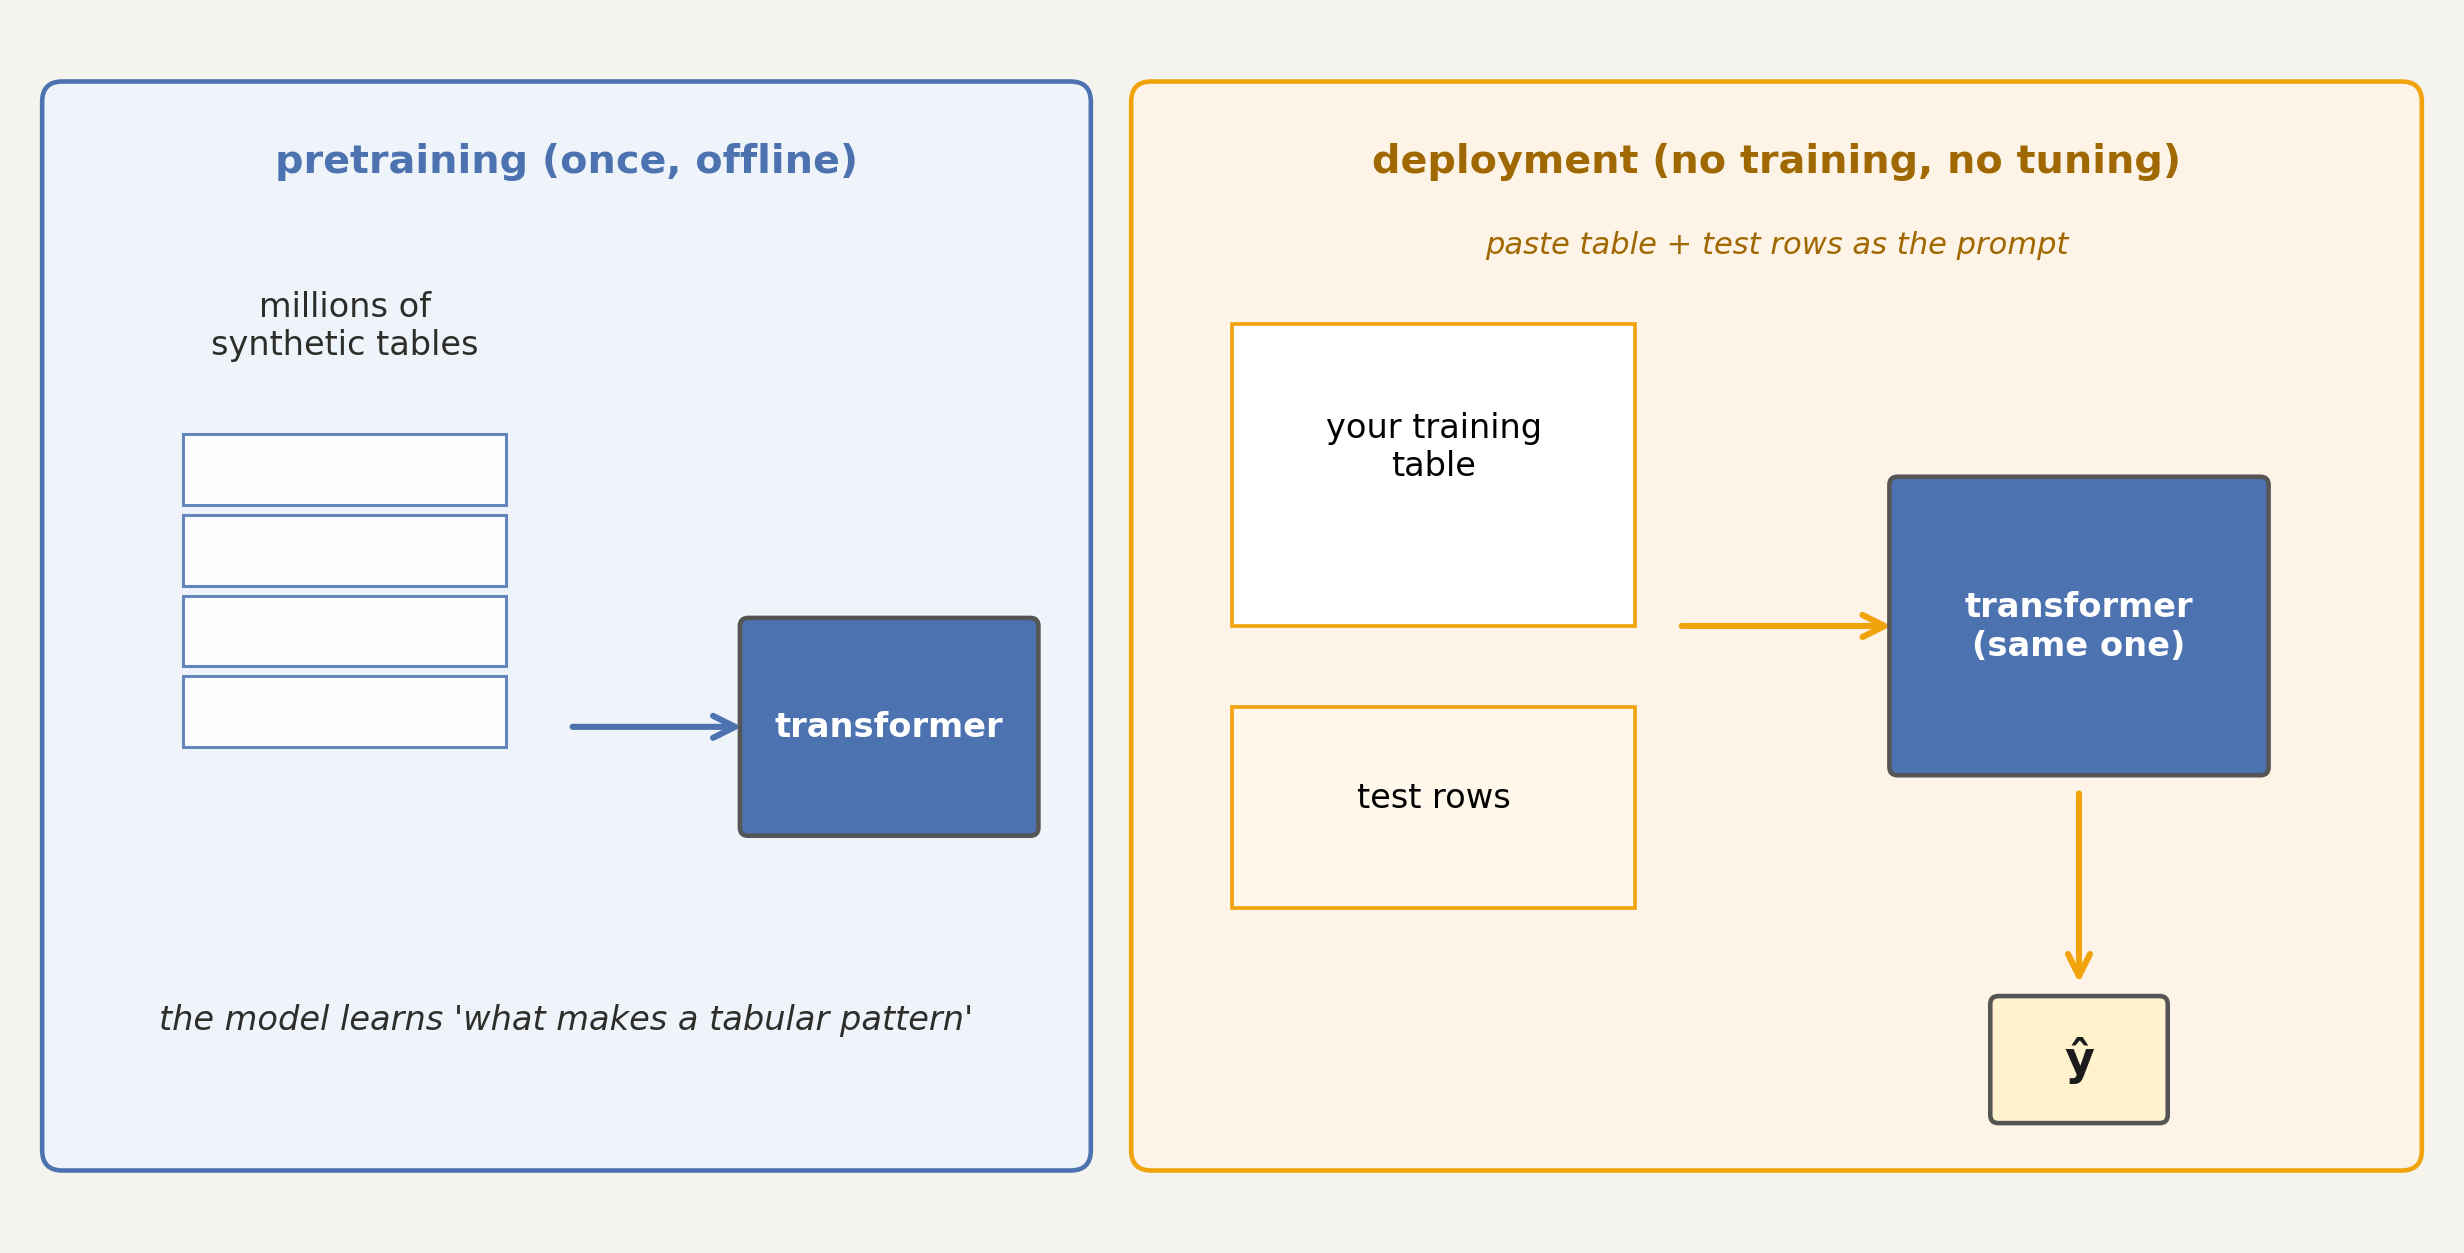
Hollmann et al., ICLR 2023; Nature 2025 (v2)
the loop
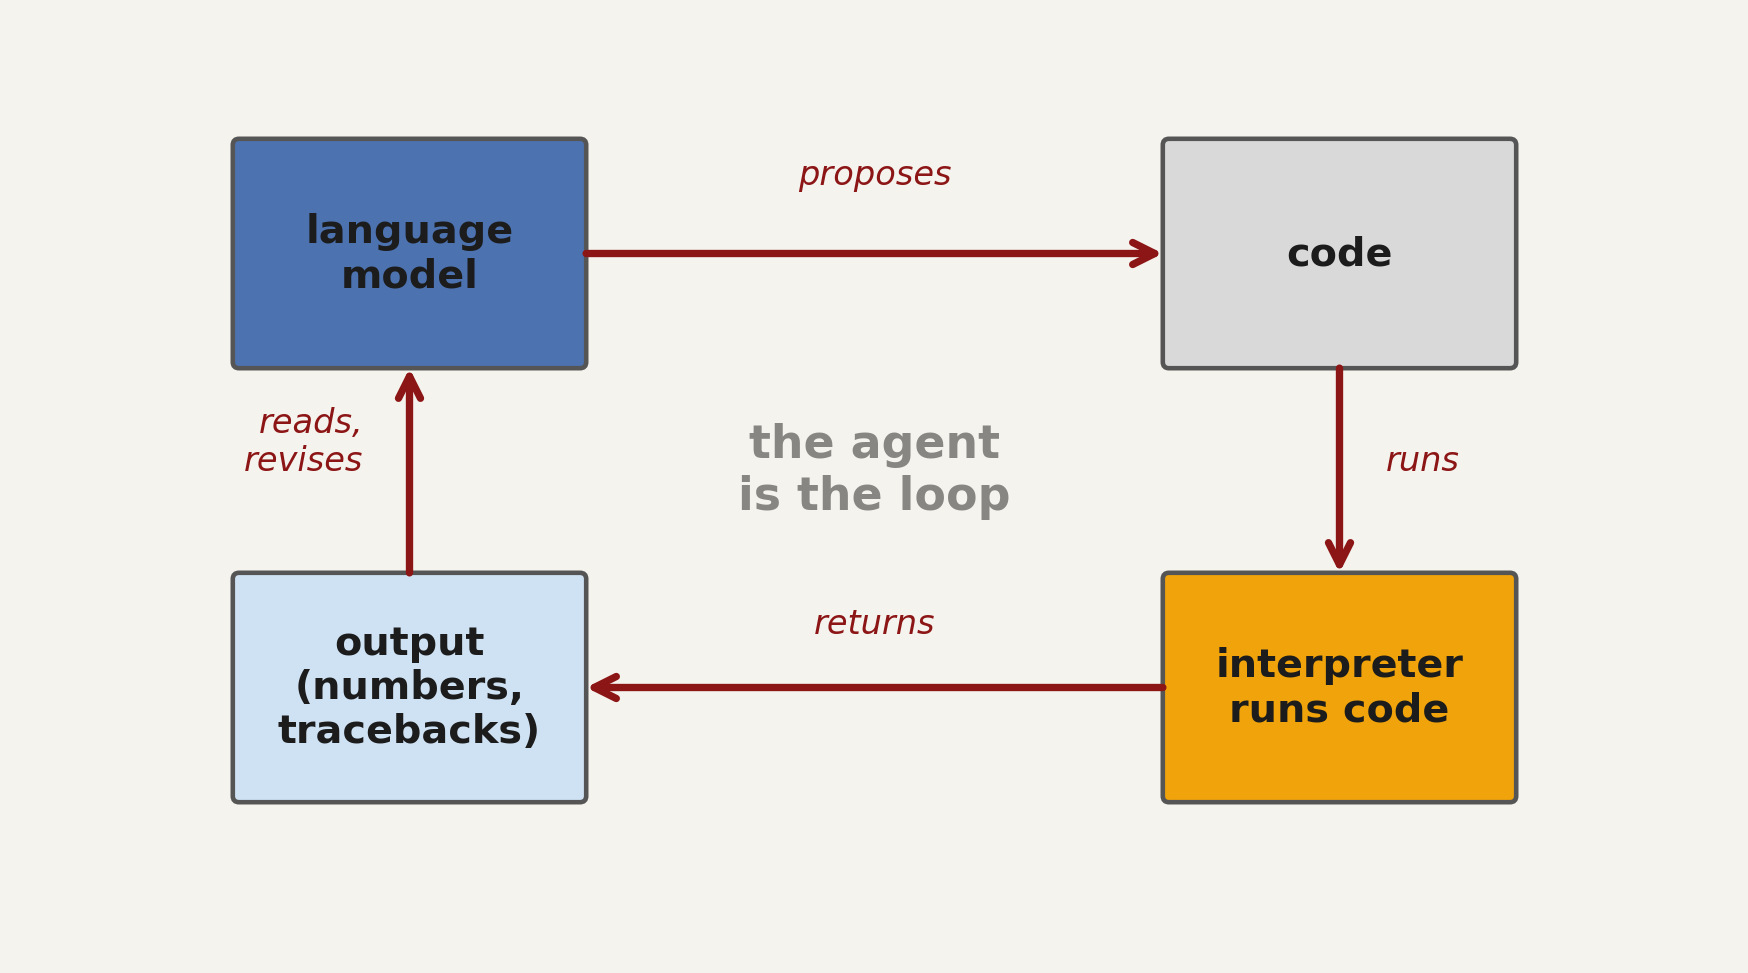
data-analysis agent: an LLM + the loop around it
same pattern across four benchmarks
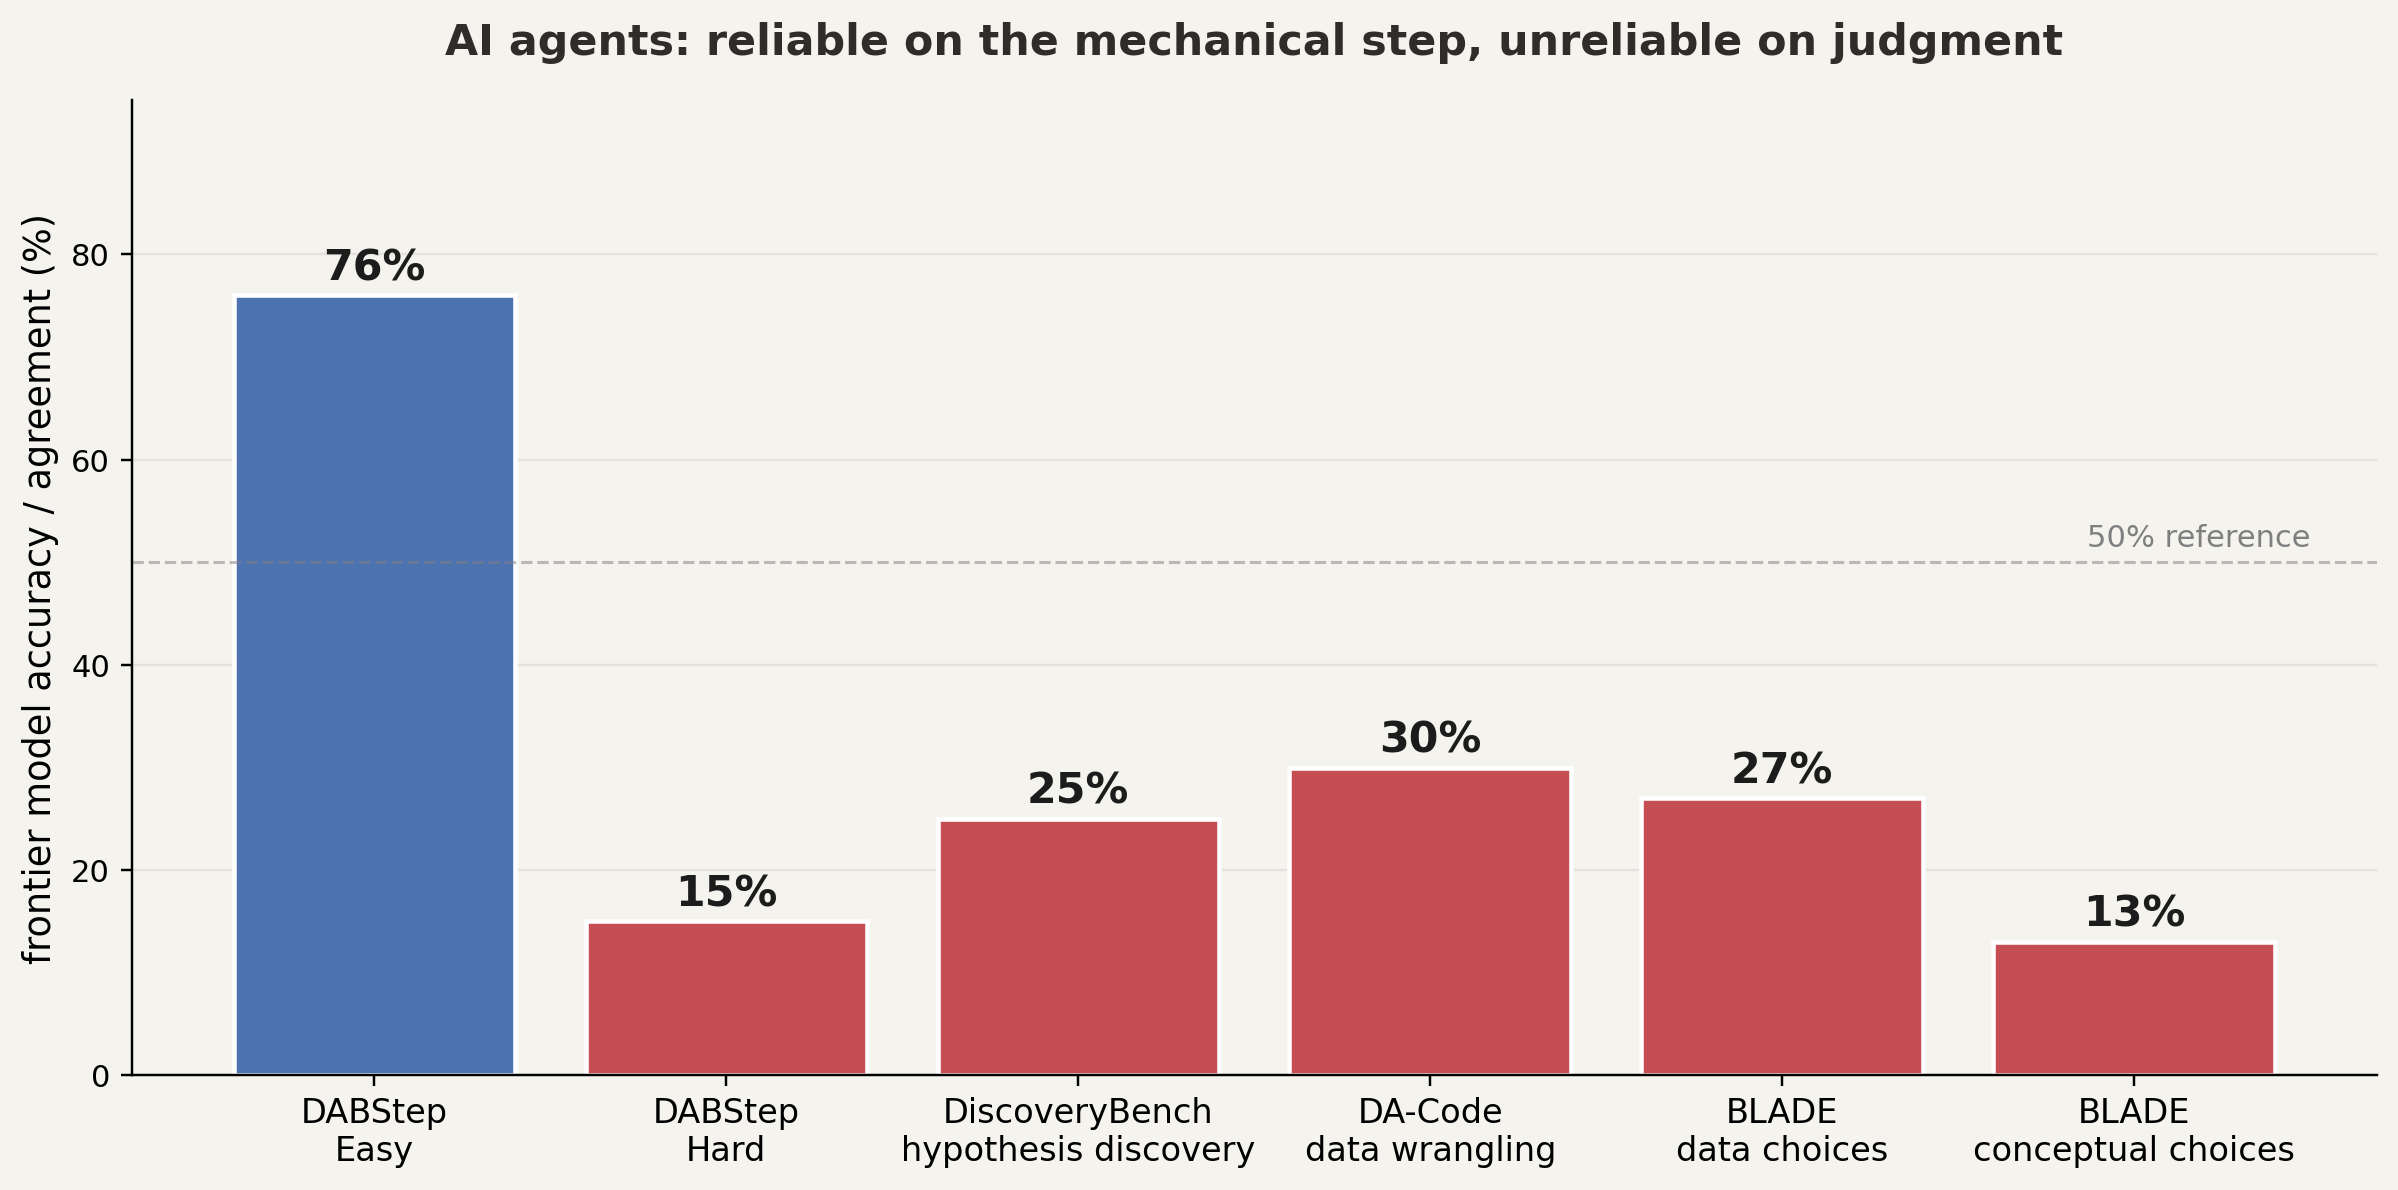
the tools converge on a narrow set of analytic choices, not the breadth an expert would weigh
DiscoveryBench: Majumder et al. 2024 · DA-Code: Huang et al. EMNLP 2024 · BLADE: Gu et al. EMNLP 2024
the well-documented failure: omission
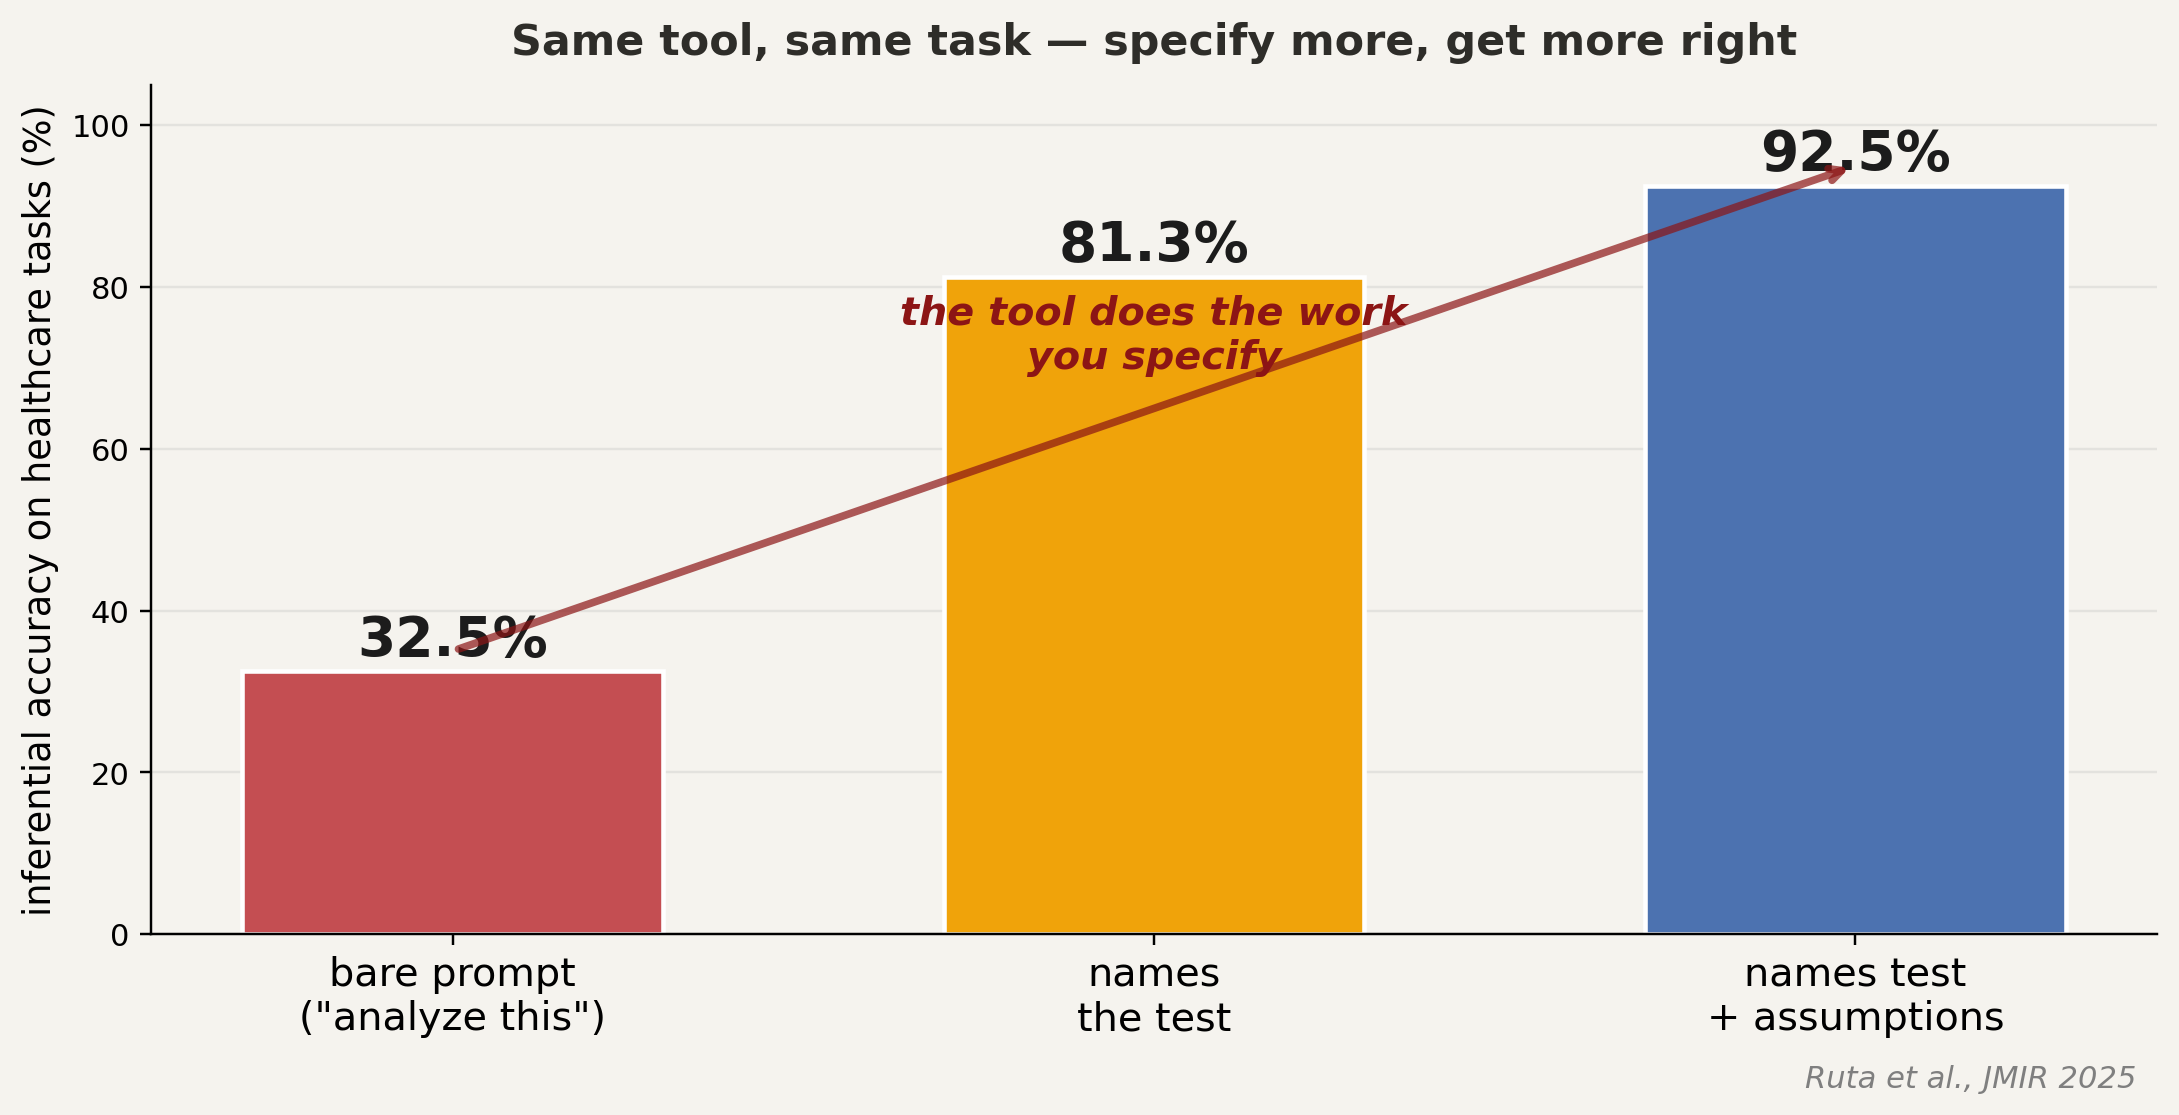
the tool does the work you specify and skips the work you do not
who survives the filter?
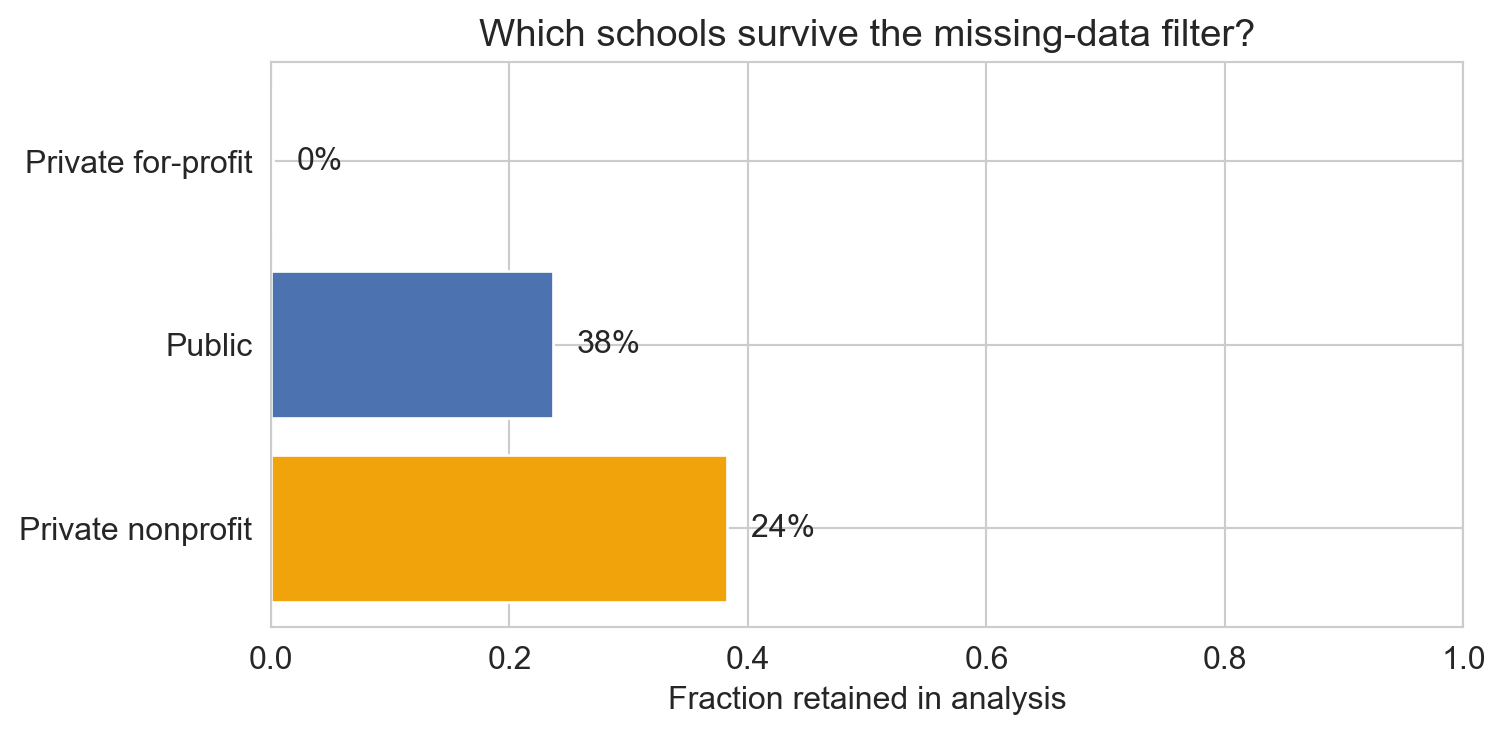
- public + private nonprofit: most schools kept
- private for-profit: ~0% retained; most lack SAT_AVG
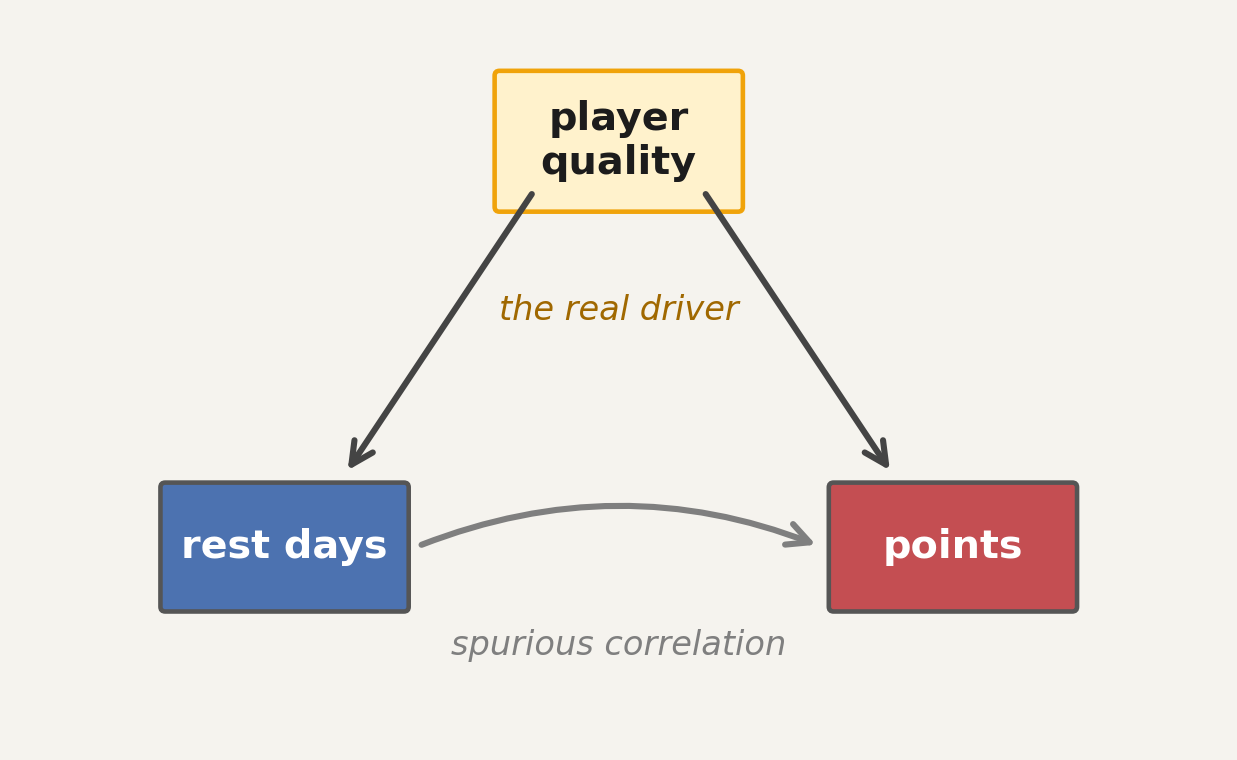
within-player effects
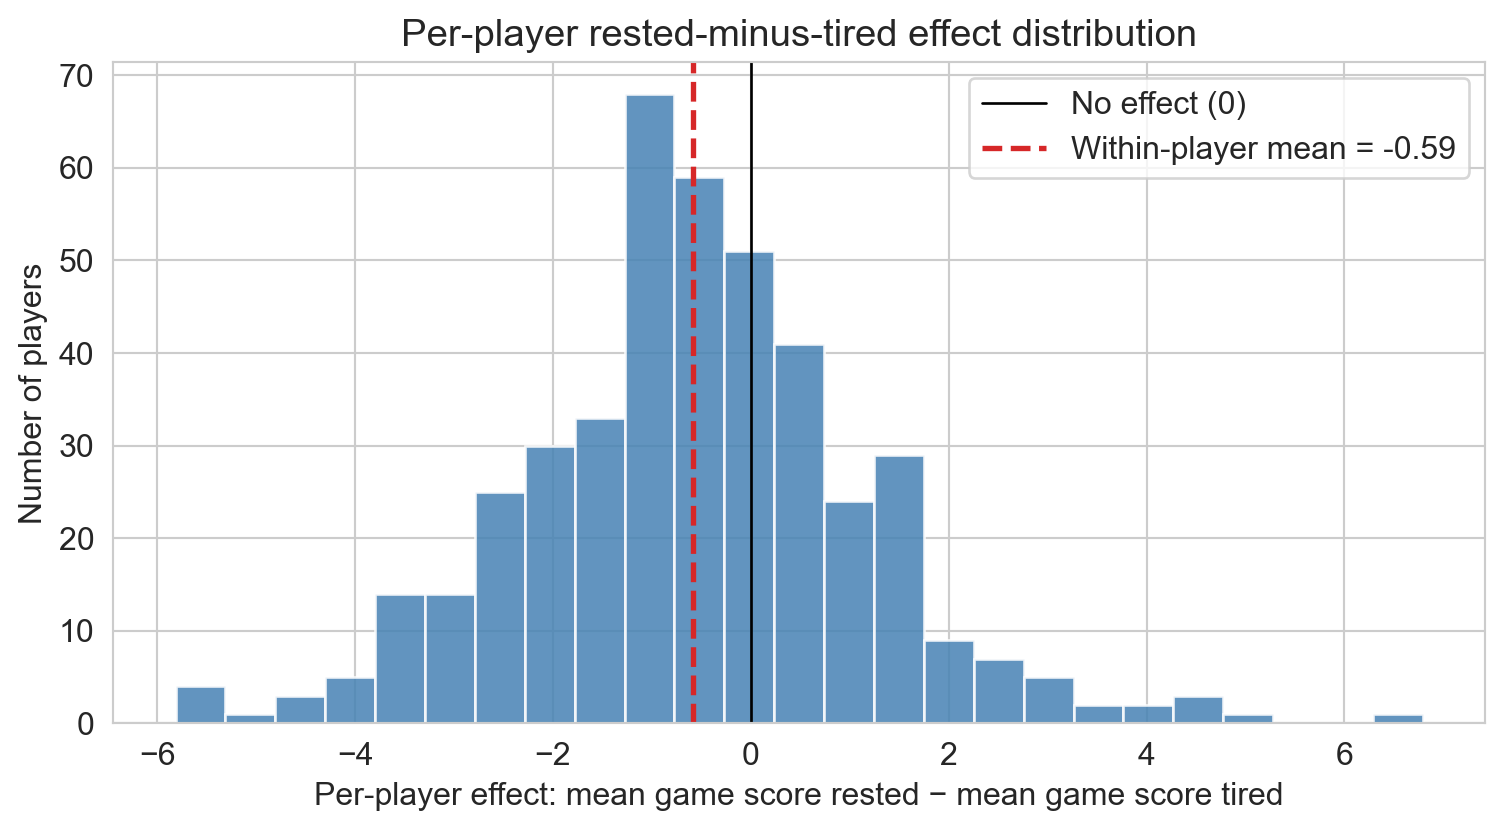
- distribution centered near zero
- mean shift under one game-score point against rest
aggregate effect came from confounding, not from rest
1. the data: where did it come from, who is missing?
- source: data dictionary? who collected it, why?
- who’s missing: exclusion changes the conclusion?
- types: numeric truly numeric? IDs treated as numbers?
Scorecard: SAT filter dropped ~100% of for-profits
Ch 2–3 · today’s worked example 1
2. the model: was it scored on data it had never seen?
- metric: right for the decision?
- split: truly held-out? temporal leakage?
- leakage: does any input encode the outcome?
- distribution shift: same population train and deploy?
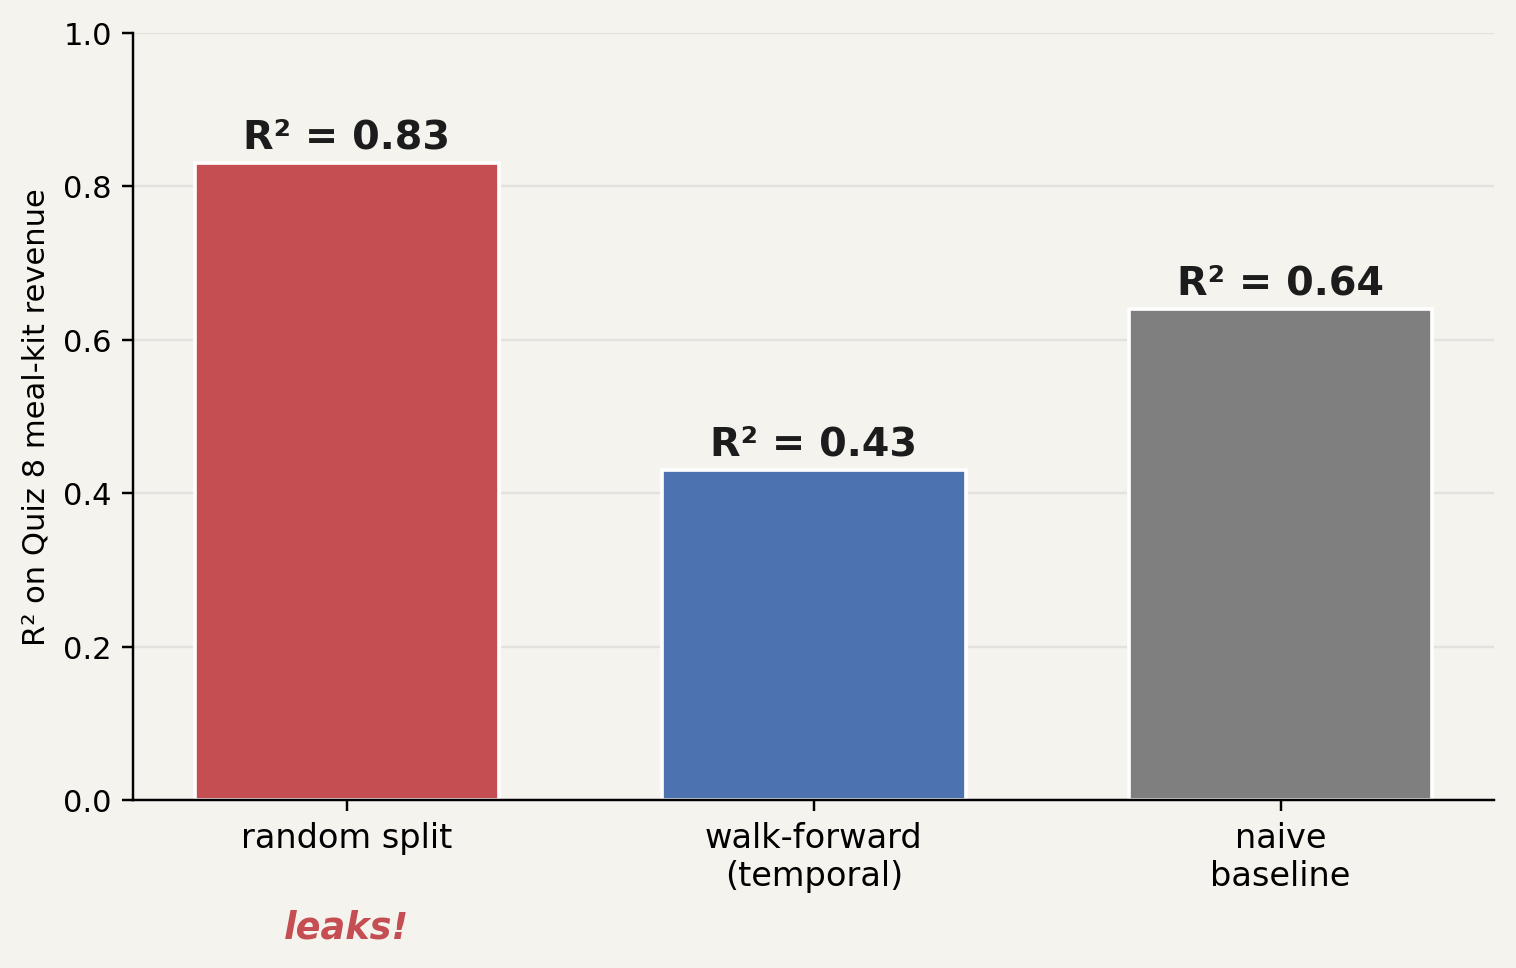
Quiz 8 revenue: random R² beat temporal R² by 0.4. the gap is leakage.
Ch 6, 7, 16
3. the signal: real, or one knob the analyst turned?
- base rate: is “99% accuracy” trivial?
- multiple testing: only hypothesis tested, or only one reported?
- uncertainty: CI? how wide?
- practical significance: large enough for the decision?
NBA: aggregate effect vanished once we controlled for player
Ch 7, 8, 10, 11, 12 · today’s worked example 2
4. the claim: causal effect, or two things that move together?
- confounding: does correlation imply causation here?
- causal structure: what would have to be true for the claim to hold?
- alternative explanations: what else could produce this pattern?
the audit’s lone unit: next two lectures with I-han turn this into a formal tool
Ch 11 → Ch 18-19 (DAGs, identification)
5. incentives + dynamics: who benefits, how does it change after deployment?
- Goodhart: could optimizing this metric cause people to game it?
- feedback loops: do predictions change the outcome being measured?
- who paid for it: does the vendor have an incentive to show a particular result?
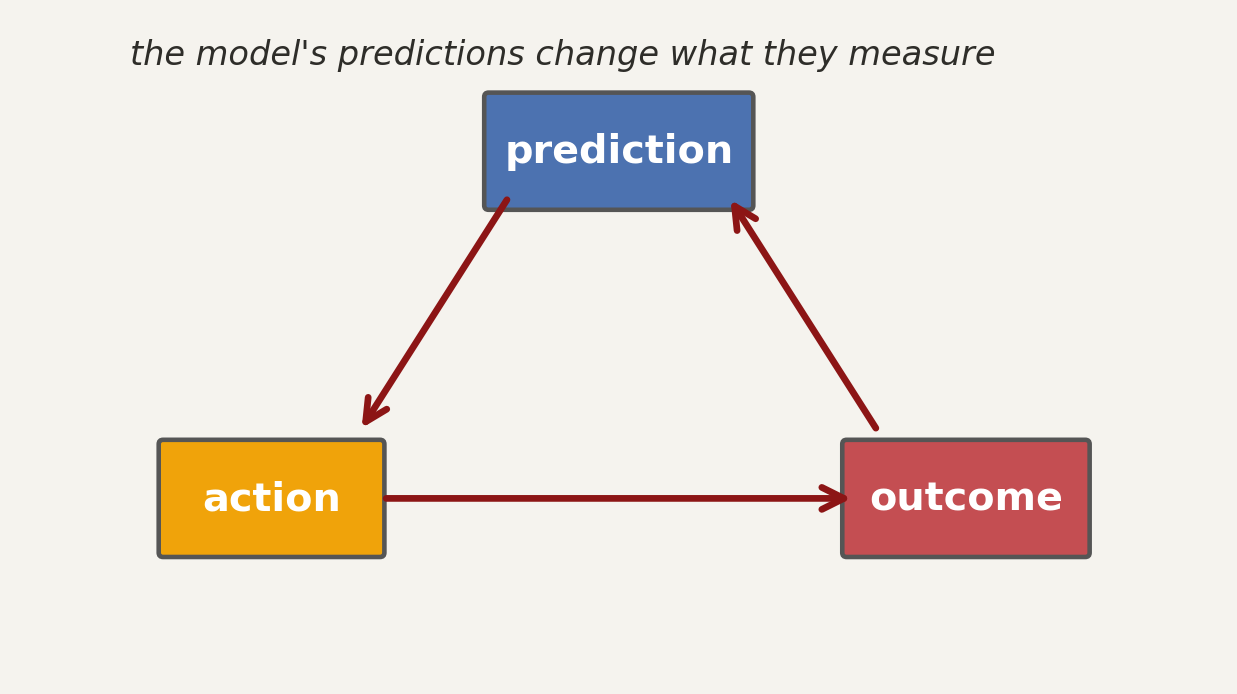
static analyses miss what changes after deployment
Ch 16 + common sense
feedback

what worked? what didn’t? what would you change?